The Almond Board of California (ABC) partnered with Land IQ, a Sacramento-based agricultural and environmental scientific research and consulting firm, to develop a comprehensive, living map of California almonds. The California almond industry map serves as a visual tool for almond growers, processors, allied industry and others to see where almond acreage is located throughout the state. It is the result of over half a decade of research and has a high degree of accuracy — 98% or greater — as Land IQ’s approach does rely on surveys or extrapolation.
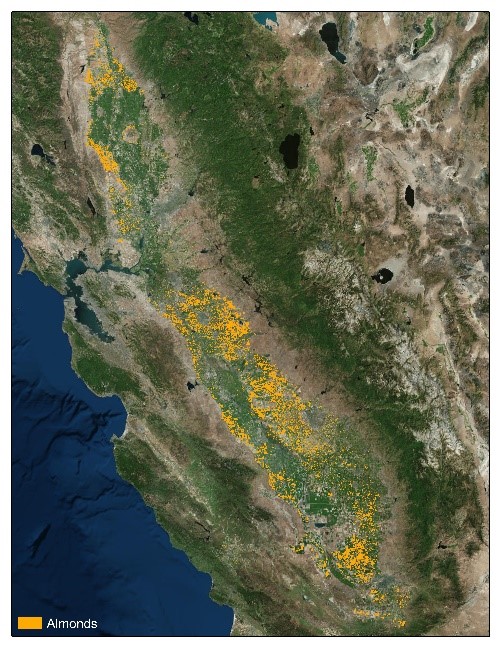
Based on the most recent mapping assessment of California almond orchards, ABC and Land IQ released a 2016 Standing Acreage Final Estimate that found that there were 1,256,671 total almond acres in 2016, whereas in the same year the USDA’s National Agricultural Statistics Service (NASS) estimated there were 1,240,000 total acres. Regarding 2016 bearing almond acreage, Land IQ found that there were 982,364 acres compared to 940,000 acres by NASS.[1][2]
In addition to the final numbers for 2016, ABC and Land IQ also released a 2018 Standing Acreage Initial Estimate, making it the first time an acreage estimate has been released in the same crop year. LandIQ’s initial estimate, which accounts for removals, determined there were 1,377,790 total almond acres in California in 2018, and found the bearing acreage increased by 106,293 acres since 2016, which amounts to 1,088,657 total bearing acres in 2018. This is the first time that Land IQ has shown California almond bearing acreage to be above the one-million mark, though NASS estimated California almonds surpassed one million bearing acres in 2017.[3]
Land IQ estimates that non-bearing acreage for 2018 — acres with one- to -three-year-old orchards — is at 289,133 acres. Individuals who view this non-bearing map layer on Land IQ’s website should note that, for orchards planted in 2017 and 2018, only fields that were visually confirmed from ground truthing will appear. The numerical estimate relies on other sources of information to arrive at a complete figure.[4]
Beyond this analysis, the comprehensive, living map of California almonds provides information on orchard age, suitability for groundwater recharge and more. One example of the map’s application is that the Almond Board used the tool to determine how many orchards would be impacted by setback distances required for sensitive sites due to the Department of Pesticide Regulation’s recent chlorpyrifos ruling.
For more information on the California almond industry map or to access various map layers, visit Almonds.com/Maps. All technical questions can be directed to Land IQ at (916) 265-6358 or technical.support@landiq.com.
[1] Land IQ. California Statewide Almond Mapping - 2016. Dec. 2018. Based on data from USDA National Agricultural Imagery Program (NAIP) and USGS Landsat
[2] USDA. National Agricultural Statistics Service, Pacific Regional Field Office. 2016 California Almond Acreage Report. Apr. 2017
[3] USDA. National Agricultural Statistics Service, Pacific Regional Field Office. 2017 California Almond Acreage Report. Apr. 2018
[4] This segment of non-bearing acreage is the most difficult to estimate and cannot be remotely sensed. The numerical estimates for 2017 and 2018 rely on ground truthing and other non-spatial information, resulting in an accuracy of +/- 10% for those years.